Is the Market Getting Cheaper or Just Early Ahead of Analyst Revisions?
By Derek Moore
Why Is the Market Getting Cheaper?
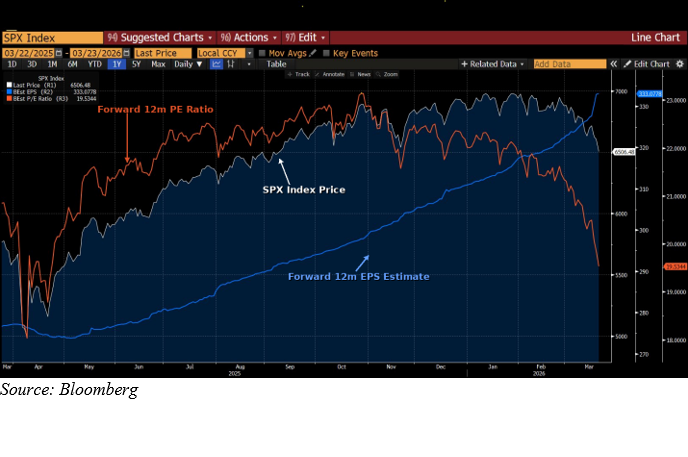
With Friday’s close, the S&P 500 Index has breached below a 20 Forward 12m PE Ratio.
Looking at the graph above, 19.53x is the level. All while analysts Forward 12m EPS estimates have gone higher to 333.08 per share. You can see that while the blue line continues higher, the red line is pointing lower. EPS estimates up, but what the market is willing to pay on a forward basis is lower.
Compare That to October when the Forward PE was over 23 and Forward EPS was lower but doing the math of PE * EPS, the S&P 500 Index was higher.
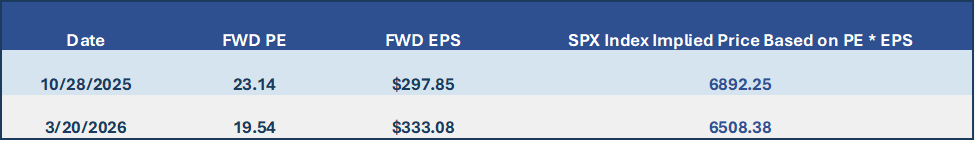
Source Bloomberg w/ ZEGA Investments Calculations
Now the market is lower because the forward multiple is lower.
This is why during our year-end prediction podcast we always point out how hard it is to pick where the S&P 500 Index price will be at the end of next December. You must get not only what the forward 12-month earnings estimates will be, but also what the forward multiple will be.
Isn’t the Market Just Anticipating Analysts Lowering Estimates?
Markets have a way of frontrunning what’s to come by drawing down before the economy gets bad and rallying off the lows in advance of numbers improving.
If analysts estimates stick and the current environment passes, the market is getting cheaper and the market is wrong. But if the market is getting ahead of analysts eventually dropping forward EPS, then it will have correctly anticipated the move ahead of time. This is why we are proponents of Buying but Hedging!
You don’t have to try and decide who’s right as most often, investors find it tough to time selling at the top and buying at the bottom.
Exxon (XOM) vs Nvidia (NVDA) Forward Valuations
At the end of 2025 we remarked on our podcast that no one wanted energy stocks and if you were a contrarian, that’s probably what you would buy.
Rather than anointing ourselves Nostradamus, it was simply the fact that it was out of favor. In Exxon’s case, the market multiple expanded ahead of analysts revising earnings upward.
Looking at those same measures on the chart below, you see that only after the move higher in the stock did analysts revise their forward 12m EPS estimates by more than 10%.
Same Chart on Exxon:
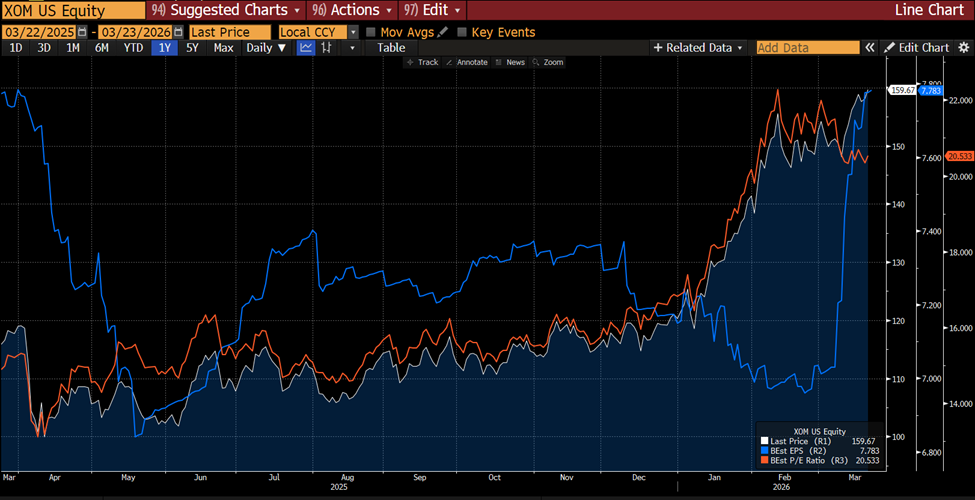
Source: Bloomberg
Exxon now has a higher forward PE ratio (20.53x) than Nvidia (19.74x).
In theory, Nvidia is cheaper than Exxon which is interesting if nothing else considering their respective businesses. Nvidia’s EPS estimates have never been higher, but their multiple has dropped from over 34 to its current level. Nvidia has been flattish since November.
Now on Nvidia:
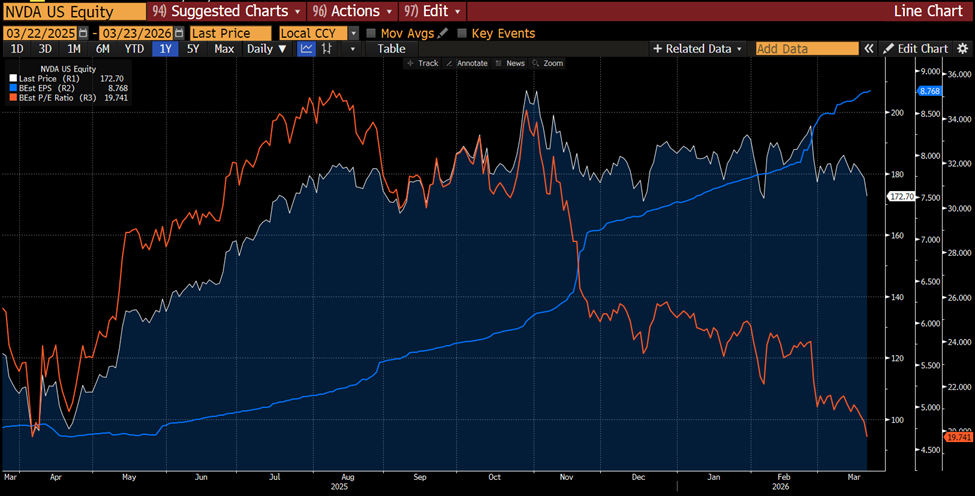 Source: Bloomberg
These are things to think about. Owning an index (and hedging) means the index is always changing with some companies rising in weight and others falling. It just sort of happens on its own.
Given the Choice Would You Rather Multiple Contraction or Earnings Contraction?
I’d rather multiples come down vs the alternative where earnings are being revised lower.
Analysts do a pretty good job of forecasting earnings these days. The tough thing is if there is a recession, and I’m not saying there will be, they often prove to be too optimistic in hindsight. These, after all, are just predictions that may or may not come true.
The real question is whether margins can continue to come in at record highs.
Looking at a different view on earnings estimates and growth, you can see that both EPS and sales forecasts are pretty positive right now.
S&P 500 Index Analyst Estimates
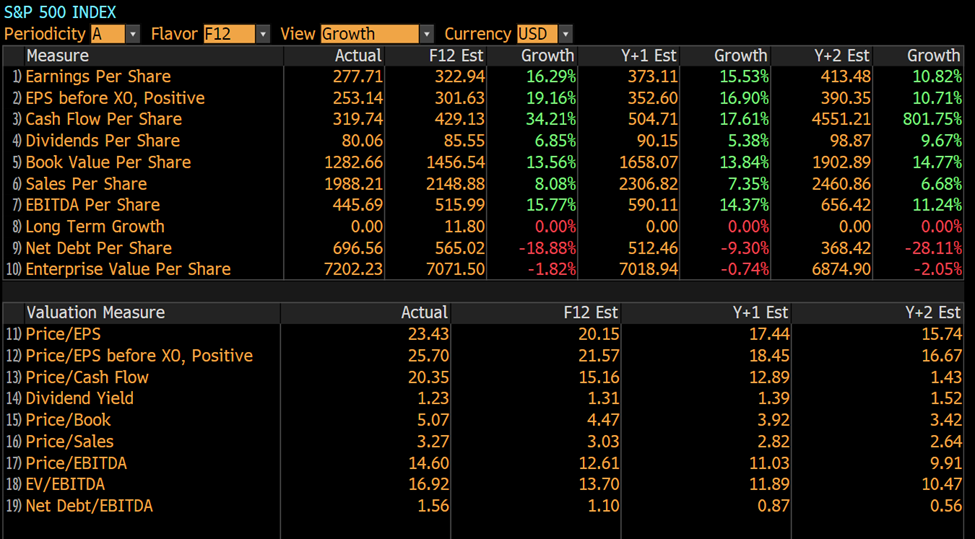
Source: Bloomberg
If we take the forward 12m EPS estimate of 322.94 into the sales estimate of 2148.88 per share (322.94 / 2148.88), you get ~ 15% net profit margin.
These are different from the blended estimates on the previous graphs, so they vary a bit, but the point is that is higher than they’ve ever been. One way to see the impact of margins on EPS would be to look at the difference in estimated EPS for a 1% change, higher or lower in margins.
Estimate of EPS Based on 2148.88 Sales Per Share Estimates vs Margin%
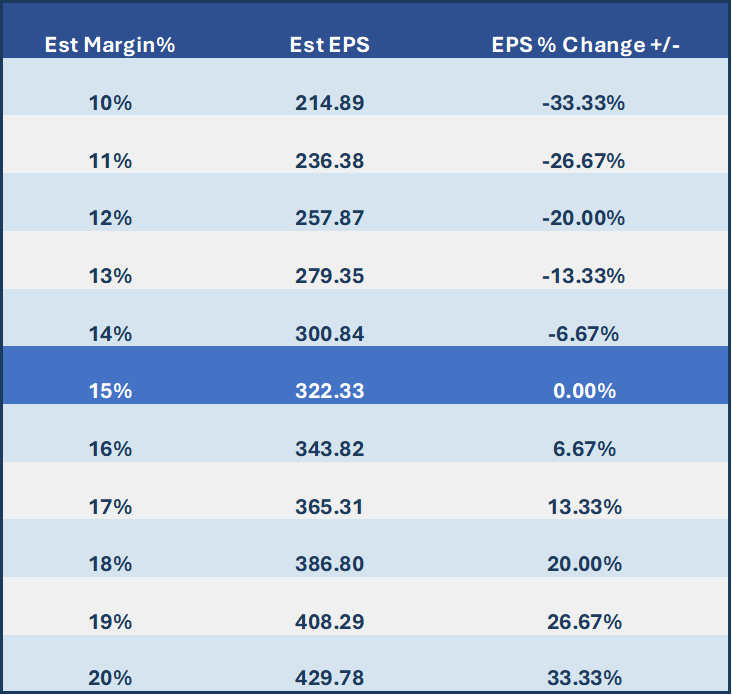
Source Bloomberg w/ ZEGA Investment Calculations
A 1% +/- change in margins results in EPS moving ~ 7% up or down.
Now apply a forward multiple to those earnings and you see how it could result in markets moving higher or lower. The reality though is that sales, margins, and EPS are always moving around as analysts adjust their numbers. We could adjust the sales per share higher or lower and keep margins the same too to get there another way.
Plus, what the market is willing to pay for those forward EPS estimates moves around thus making this more art than science.
What Should You Be Thinking About?For a while watching CNBC or Bloomberg TV, you heard pundits complain about the market being expensive on a valuation basis.
It just got a little cheaper right? Sure, now the pundits will say earnings estimates haven’t priced in higher oil, higher dollar, economic stress. There is always a wall of worry in markets and often, what investors are worried about doesn’t wind up being the thing (if there is a thing) that causes an issue.
But you should be thinking if I don’t need to access funds from my accounts over the next 6 months to a year, and your situation (goals) haven’t materially changed, then there may not be anything to do right now.
And this is why we hedge (or buffer) so that you don’t feel like you need to be on the buy or sell button.
Peter Lynch on Market Corrections from 1994
 Back in 1994 Peter Lynch gave a great speech for the National Press Club where he talked about how frequent market corrections happen and how to look at them.
So, is the market or analysts right on markets? I’ll let you know in a few months.
Until then stay invested but hedged.